GeoMesa Storm Quick Start
Apache Storm is “a free and open source distributed realtime computation system.”
You can leverage Storm to analyze and ingest data into GeoMesa in near real time. In this tutorial, we will:
Use Apache Kakfa to send messages to a Storm topology.
Use Storm to parse Open Street Map (OSM) data files and ingest them into Accumulo.
Leverage Geoserver to query and visualize the data.
Prerequisites
You will need access to:
an instance of Accumulo 1.7.x, 1.8.x, 1.9.x or 2.0.x,
an Accumulo user with create-table and write permissions,
an installation of Kafka 0.10.x or later,
an installation of Storm 0.9+, and
an instance of GeoServer 2.17.3 with the GeoMesa Accumulo plugin. installed
In order to install the GeoMesa Accumulo GeoServer plugin, see Installing GeoMesa Accumulo in GeoServer.
You will also need:
The xz data compression tool,
Apache Maven 3.5.2 or later, and
a git client.
Download and Build the Tutorial
Pick a reasonable directory on your machine, and run:
$ git clone https://github.com/geomesa/geomesa-tutorials.git
$ cd geomesa-tutorials
Note
You may need to download a particular release of the tutorials project to target a particular GeoMesa release.
To build, run
$ mvn clean install -pl geomesa-quickstart-storm
Note
Ensure that the version of Accumulo, Hadoop, Storm,
etc in the root pom.xml match your environment.
Note
Depending on the version, you may also need to build GeoMesa locally. Instructions can be found in Installation.
Obtaining OSM Data
In this demonstration, we will use the simple-gps-points OSM data
that contains only the location of an observation. Download the
OSM data
here.
Note
The file is approximately 7 GB.
Use the following command to unpack the data:
$ xz simple-gps-points-120312.txt.xz
Deploy the Ingest Topology
The quickstart topology will read messages off of a Kafka topic, parse
them into SimpleFeatures, and write them to Accumulo.
Use storm jar to submit the topology to your Storm instance:
$ storm jar geomesa-quickstart-storm/target/geomesa-quickstart-storm-$VERSION.jar \
    com.example.geomesa.storm.OSMIngest \
    -instanceId <accumulo-instance-id>  \
    -zookeepers <zookeepers>            \
    -user <accumulo username>           \
    -password <accumulo password>       \
    -tableName OSM                      \
    -featureName event                  \
    -topic OSM
Run Data through the System
We use Kafka as the input to our Storm topology. First, create a topic to send data:
For Kafka 0.8 use the following command.
$ kafka-create-topic.sh      \
    --zookeeper <zookeepers> \
    --replica 3              \
    --partition 10           \
    --topic OSM
For Kafka 0.9+ use the following command.
$ kafka-topics.sh          \
    --create               \
    --zookeeper localhost  \
    --replication-factor 3 \
    --partitions 10        \
    --topic OSM
Note that we create a topic with several partitions in order to parallelize the ingest from the producer side as well as from the consumer (Storm) side.
Next, use the tutorial code to send the OSM file as a series of Kafka messages:
$ java -cp geomesa-quickstart-storm/target/geomesa-quickstart-storm-$VERSION.jar \
    com.example.geomesa.storm.OSMIngestProducer \
    -ingestFile simple-gps-points-120312.txt    \
    -topic OSM                                  \
    -brokers <kafka broker list>
Note that Kafka’s default partitioner class assigns a message partition based on a hash of the provided key. If no key is provided, all messages are assigned the same partition.
for (String x = bufferedReader.readLine(); x != null; x = bufferedReader.readLine()) {
    producer.send(new KeyedMessage<String, String>(topic, String.valueOf(rnd.nextInt()), x));
}
Storm Spouts and Bolts
In the quick start code, the Storm Spouts consume messages from a
Kafka topic and send them through the ingest topology:
public void nextTuple() {
    if (kafkaIterator.hasNext()) {
        List<Object> messages = new ArrayList<Object>();
        messages.add(kafkaIterator.next().message());
        _collector.emit(messages);
    }
}
The Bolts parse the message and create and write
SimpleFeatures. In the prepare method of the Bolt class,
we grab the connection parameters that were initialized in the
constructor and get a handle on a FeatureWriter:
ds = DataStoreFinder.getDataStore(connectionParams);
SimpleFeatureType featureType = ds.getSchema(featureName);
featureBuilder = new SimpleFeatureBuilder(featureType);
featureWriter = ds.getFeatureWriter(featureName, Transaction.AUTO_COMMIT);
The input to the Bolt’s execute method is a Tuple containing a
String. We split the String on ‘%’ to get individual points. For
each point, we split on commas to extract the attributes. We parse the
latitude and longitude field to set the default geometry of our
SimpleFeature. Note that OSM latitude and longitude values are
stored as integers that must be divided by 107.
private Geometry getGeometry(final String[] attributes) {
    ...
    final Double lat = (double) Integer.parseInt(attributes[LATITUDE_COL_IDX]) / 1e7;
    final Double lon = (double) Integer.parseInt(attributes[LONGITUDE_COL_IDX]) / 1e7;
    return geometryFactory.createPoint(new Coordinate(lon, lat));
}

public void execute(Tuple tuple) {
    ...
    featureBuilder.reset();
    final SimpleFeature simpleFeature = featureBuilder.buildFeature(String.valueOf(UUID.randomUUID().getMostSignificantBits()));
    simpleFeature.setDefaultGeometry(getGeometry(attributes));

    try {
        final SimpleFeature next = featureWriter.next();
        for (int i = 0; i < simpleFeature.getAttributeCount(); i++) {
            next.setAttribute(i, simpleFeature.getAttribute(i));
        }
        ((FeatureIdImpl) next.getIdentifier()).setID(simpleFeature.getID());
        featureWriter.write();
    } catch (Exception e) {
      ...
    }
}
Register the Layer in GeoServer
Log into GeoServer using your credentials. Click “Stores” in the left-hand gutter and “Add new Store”. If you do not see the Accumulo Data Store listed under Vector Data Sources, ensure the plugin and dependencies are in the right directory and restart GeoServer.
Select the Accumulo (GeoMesa) vector data source and configure it
using the command line arguments you used above. Use geomesa as the
workspace - if you use something different, you will need to modify the
WMS requests below.
Leave all other fields empty or with the default value.
Click “Save” and GeoServer will search your data store for any available feature types.
Publish the Layer
GeoServer should find the OSM feature type and present it as a layer
that can be published. Click on the “Publish” link. You will be taken to
the Edit Layer screen.
You can leave most fields as default. In the Data pane, you’ll need to enter values for the bounding boxes. In this case, you can click on the links to compute these values from the data. Click “Save”.
Visualize the Data
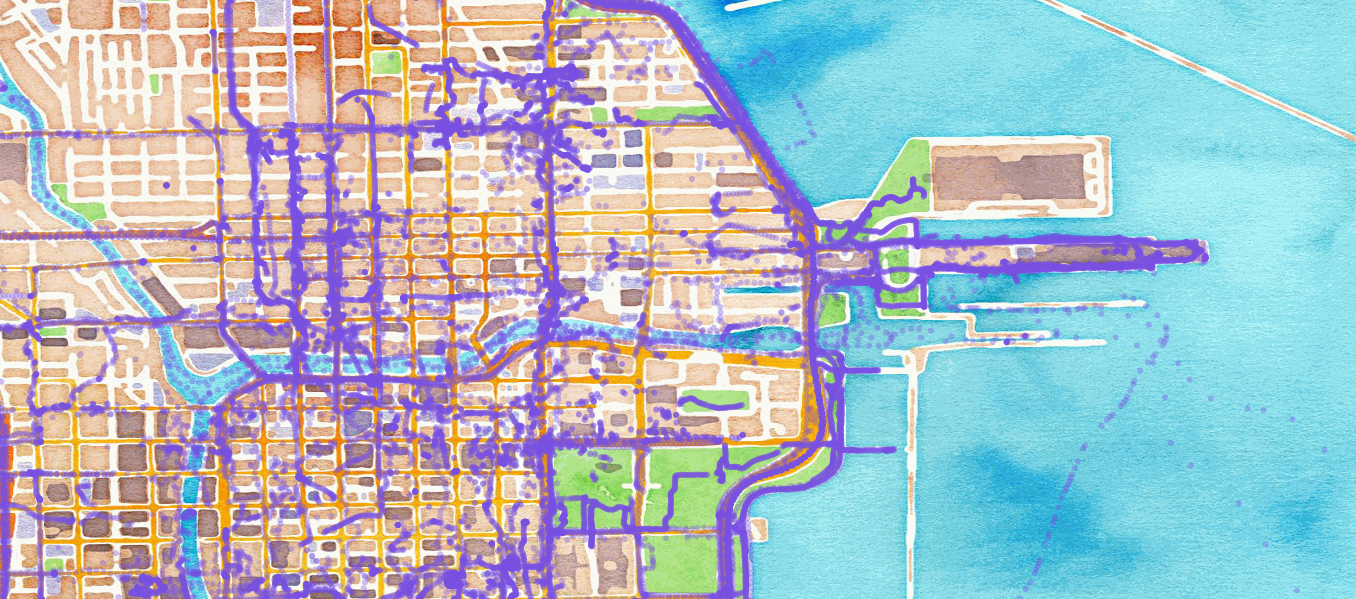
Let’s look at events in Chicago. The default point style is a red square
that does not suit our purposes. Add
the OSMPoint.sld file to
GeoServer, then browse to the following URL:
http://localhost:8080/geoserver/wms?service=WMS&version=1.1.0&request=GetMap&layers=geomesa:OSM&styles=OSMPoint&bbox=-87.63,41.88,-87.61,41.9&width=1400&height=600&srs=EPSG:4326&format=application/openlayers

Showing all OSM events in Chicago before Mar 12, 2012
Heatmaps
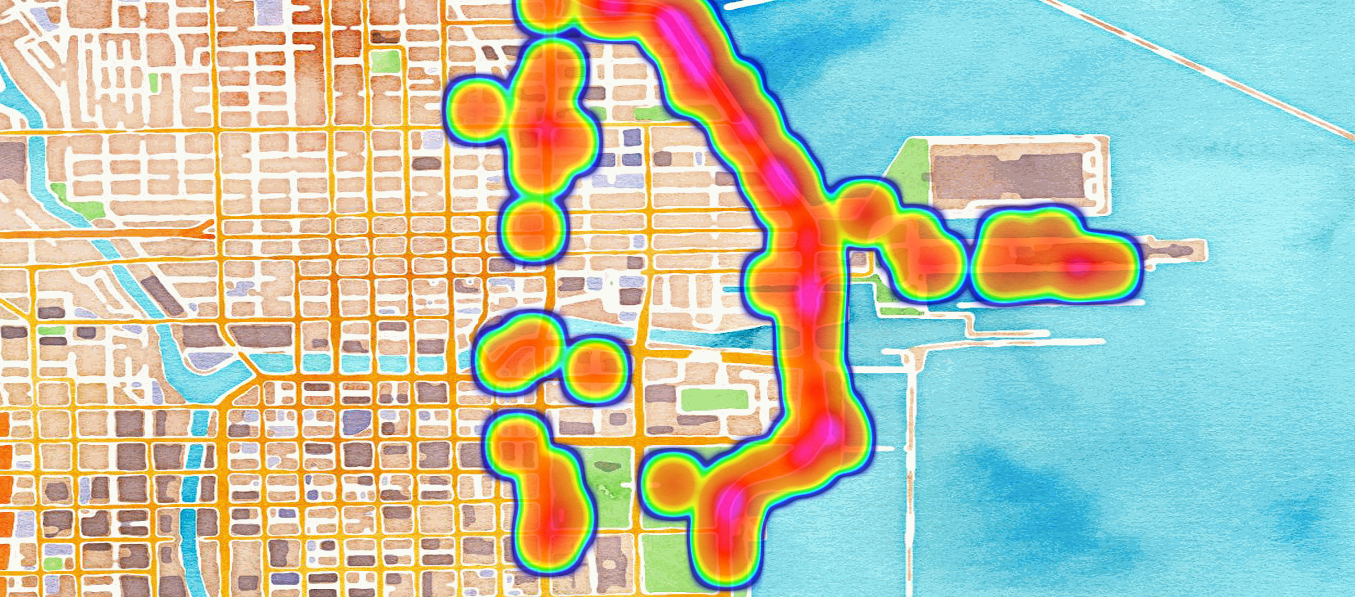
Use a heatmap to more clearly visualize a high volume of data in the same location.
Note
The heatmap style requires that the GeoServer WPS plugin be installed in your GeoServer, as described in GeoMesa Processes.
Add the
heatmap.sld file to
GeoServer, then browse to the following URL:
http://localhost:8080/geoserver/wms?service=WMS&version=1.1.0&request=GetMap&layers=geomesa:OSM&styles=heatmap&bbox=-87.63,41.88,-87.61,41.9&width=1400&height=600&srs=EPSG:4326&format=application/openlayers

Showing heatmap of OSM events in Chicago before Mar 12, 2012
Conclusion
Although this quickstart uses a static file for input, Storm excels at reading real time data. As data comes in, the Storm topology can parse it and ingest it into GeoMesa for retrieval. Additional analytics can be run on the data inside the topology to further enhance or inform the output. For real time visualization, GeoMesa also supports maps powered by Kafka instead of Accumulo. See the GeoMesa Kafka Quick Start tutorial for more details.